
When your application behaves strangely, you want to know what happened with a single request: which key, which model, how long it took, what it cost and why it may have failed. That's exactly what the request log under Requests shows you.
The list of requests
Open Requests in the dashboard. Each row is one request from your application, with the newest at the top. You can see:
- Time, accurate to the second
- Key used for the request
- Model: the requested model and, below it, the provider and model that actually responded
- Status, plus the error code for failures
- Duration in milliseconds
- Tokens as input / output
- Cost of the request in euros
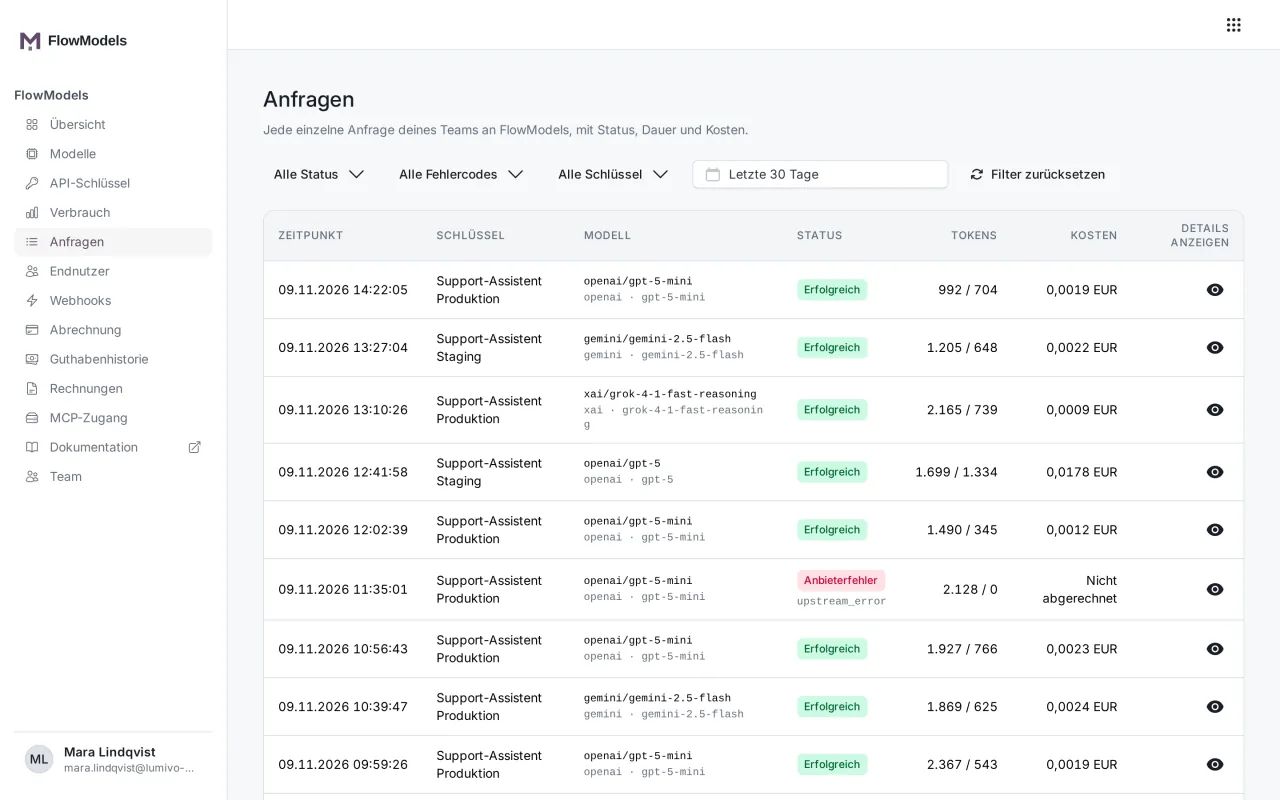
Each page shows 25 requests, and you can page through them at the bottom.
Status overview
- Successful: The model responded and the request was billed.
- Provider error: The AI provider reported an error or couldn't be reached.
- Invalid request: The request was malformed, for example a wrong field value or a parameter the model doesn't know.
- Too many requests: The per-minute request limit or the number of concurrent requests was reached.
- Connection dropped: Your application closed the connection before the response was finished.
- Not authenticated: The key was missing, invalid, expired or revoked.
If a request was rejected because the credit wasn't sufficient or a spending limit was reached, the status is credit_error. If the input was too large, it's limit_error. The exact reason is then shown with the error code.
For requests that weren't billed, Cost shows the note Not billed. Understanding FlowModels error messages explains what each error code means.
Filtering
You can narrow down the requests above the list:
- All statuses: only successful ones or only a specific type of error.
- All error codes: only requests with a specific error code, for example
rate_limit_exceeded. - All keys: only the requests of one key.
- Period: the default is the last 30 days.
Reset filters takes you back to the full list. As with usage, the filters are part of the address bar, so you can share a filtered view as a link.
Request details
Click the eye icon (Show details) on the right of the row. The Request window shows all the information at a glance, additionally split into Prompt tokens and Completion tokens, plus the Error code.
The identifier at the top of the window is the request ID. Include it in a support request and we'll find the case right away.
Good to know
- The content of requests and responses is deliberately not shown here. The log contains only key data, no text from your users.
- For analysis across many requests, Usage with its CSV export is usually more practical.
- If Too many requests keeps showing up, take a look at Request limit: how the tiers work.